Normalization and Standardization
Normalization and Standardization
Normalization/standardization are designed to achieve a similar goal, which is to create features that have similar ranges to each other and are widely used in data analysis to help the programmer to get some clue out of the raw data.
This notebook includes:
- Normalization
- Why normalize?
- Standardization
- Why standardization?
- Differences?
- When to use and when not
- Python code for Simple Feature Scaling, Min-Max, Z-score, log1p transformation
Import Libraries
import pandas as pd
import numpy as np
import seaborn as sns
import matplotlib.pyplot as plt
%matplotlib inline
sns.set_style("whitegrid") #possible choices: white, dark, whitegrid, darkgrid, ticks
House Prices Dataset from https://www.kaggle.com/c/house-prices-advanced-regression-techniques
train = pd.read_csv('train.csv')
train['SalePrice'].head()
0    208500
1    181500
2    223500
3    140000
4    250000
Name: SalePrice, dtype: int64
sns.distplot(train['SalePrice'])
<matplotlib.axes._subplots.AxesSubplot at 0x207befa1e10>

Normalization and Standardization
Normalization/standardization are designed to achieve a similar goal, which is to create features that have similar ranges to each other and are widely used in data analysis to help the programmer to get some clue out of the raw data.
Normalization
It is the process of rescaling values between [0, 1].
Why normalization?
- Normalization makes training less sensitive to the scale of features, so we can better solve for coefficients. Outliers are gone, but still remain visible within the normalized data.
- The use of a normalization method will improve analysis for some models.
- Normalizing will ensure that a convergence problem does not have a massive variance, making optimization feasible.
Standardization
It is the process of rescaling the features so that they’ll have the properties of a Gaussian distribution with μ=0 and σ=1.
Why standardization?
- Compare features that have different units or scales.
- Standardizing tends to make the training process well behaved because the numerical condition of the optimization problems is improved.
Differences?
- Sometimes, when normalization does not work, standardization might do the work.
- When using standardization, your new data aren’t bounded (unlike normalization).
When to use and when not
Use for algorithms like:
- k-Nearest Neighbors
- k-Means
- Logistic Regression
- SVM
- Perceptrons
- PCA and LDA
Don’t use for algorithms like:
- Decision Tree
- Random Forest
- XGBoost
- LightGBM
Normalization Method 1 - Simple Feature Scaling
Data is rescaled and new values are in [0, 1].
train1 = train.copy()
train1['SalePrice'] = train1['SalePrice']/train1['SalePrice'].max()
train1['SalePrice'].head()
0    0.276159
1    0.240397
2    0.296026
3    0.185430
4    0.331126
Name: SalePrice, dtype: float64
Normalization Method 2 - Min-Max
Data is rescaled and new values are in [0, 1].
train2 = train.copy()
train2['SalePrice'] = (train2['SalePrice']-train2['SalePrice'].min())/(train2['SalePrice'].max()-train2['SalePrice'].min())
train2['SalePrice'].head()
0    0.241078
1    0.203583
2    0.261908
3    0.145952
4    0.298709
Name: SalePrice, dtype: float64
Standarization - Z-score
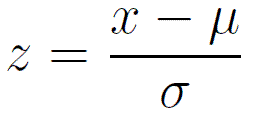
It is the process of rescaling the features so that they’ll have the properties of a Gaussian distribution with μ=0 and σ=1
where μ is the mean and σ is the standard deviation from the mean; standard scores (also called z scores) of the samples are calculated as follows:
train3 = train.copy()
train3['YrSold'] = (train3['YrSold']-train3['YrSold'].mean())/train3['YrSold'].std()
train3['YrSold'].head()
0    0.138730
1   -0.614228
2    0.138730
3   -1.367186
4    0.138730
Name: YrSold, dtype: float64
Transformation - log1p transformation.
Usually used to transform price values to log. Then, applying statistical learning becomes a lot easier.
Also, in case of positive skewness, log transformations usually works well.
train4 = train.copy()
train4['SalePrice'] = np.log1p(train3['SalePrice'])
train4['SalePrice'].head()
0    12.247699
1    12.109016
2    12.317171
3    11.849405
4    12.429220
Name: SalePrice, dtype: float64
sns.distplot(train4['SalePrice'])
<matplotlib.axes._subplots.AxesSubplot at 0x2079c9483c8>

Sources:
Medium - Standardize or Normalize? — Examples in Python
Quora - What is the difference between normalization, standardization, and regularization for data?


Leave a Comment