
Battle of the Cities
Let’s suppose that you want to relocate. You don’t know where, yet. You have enough money in order to relocate and then search for a job in your new city. You did a quick search for the most livable cities in the world. On the web you found that the top 10 cities to live are:
- Vienna, Austria
- Melbourne, Australia
- Osaka, Japan
- Calgary, Canada
- Sydney, Australia
- Vancouver, Canada
- Toronto, Canada
- Tokyo, Japan
- Copenhagen, Denmark
- Adelaide, Australia
This list seems ok. But it’s not enough for you. It’s not for me either. Good thing that I will help us both.
Describing the problem
- I won’t do a comparison on stability, healthcare, culture, environment, education and infrastructure. Let’s observe cities with a different aspect.
- What I will do is to compare the cities in terms of venues, like coffee shops, restaurants, stadiums, playgrounds, parks, pubs, supermarkets, banks, gyms etc.
- I will cluster the cities and it will be revealed which cities are similar based on their venues.
- I am curious to see which other cities belong to the same cluster as my hometown. Aren’t you also curious about yours?
- I am also curious to see how cities from different countries and continents count. Is Tokyo similar to Beijing or New York?
- The clustering will be useful for enterprises. If one company has stores in a city and thrives, then why not expand in another city of the same cluster?
Tools and Data
- Python and pandas
- Cities. I will choose a lot of cities to cluster. I will put them in a Python list
- Coordinates. Using a Python’s library called Geocoder, I will convert cities to their latitude and longitude
- Venues. Using Foursquare’s API, I will get the venues for each city
- Clusters. Using scikit’s learn k-means clustering algorithm I will cluster the cities. As features for the cluster, will be the mean of the frequency of occurrence of each category in each city
- Map. Using Folium I will create maps to visualize the clusters
Methodology
- First, a list of cities of interest was hand-written, consisting of 94 cities all around the world
- Using Geocoder the coordinates of every city was found by its name
- All this information was inserted into a Pandas dataframe with 3 columns, namely ‘City’, ‘Latitude’, ‘Longitude’
- Using Foursquare up to 100 (limited by the api) venues of each city were derived and their category (e.g. Italian Restaurant) was stored in a dataframe
- A total of 8854 venues were collected. 14 cities had <100 venues
- A total of 459 venue categories were collected
- Because we have categorical data, in order for k-means (clustering algorithm) to work, we have to transform them into numerical. One-hot encoding was used for this reason
- After grouping the cities each row is a city, each venue category is a column and each cell has values of 0 or 1 if i has not or has a particular venue category. Instead of zeros and ones, the mean of the frequency of occurrence of each category was used
- The city with the highest frequency of each venue category is also reported
Results and Discussion
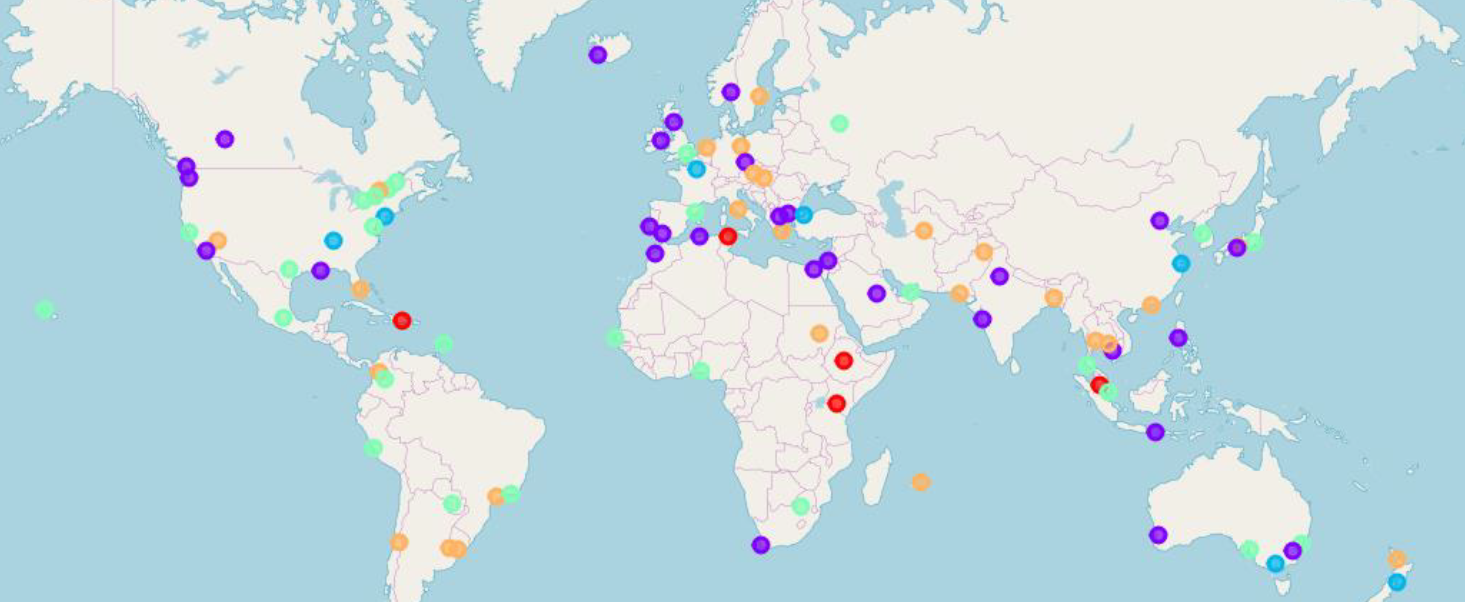 There are 2 small clusters consisting of 5 and 7 cities (red and blue).
The other cities are grouped in 3 bigger clusters with comparable sizes of 29, 27 and 26.
There are 2 small clusters consisting of 5 and 7 cities (red and blue).
The other cities are grouped in 3 bigger clusters with comparable sizes of 29, 27 and 26.
Let’s analyze each continent based on the map and the clusters.
- Central and North America - All 5 clusters are encountered in this half-continent. We can clearly see a big variety and no cluster is dominant with much more cities
- South America - Cities here are divided between 2 clusters only. Cluster 3 and 4 (green and orange). This half-continent shows more homomorphy
- Cluster 3 (green) has more occurences in America than the rest of the world, where it is more spread and random distributed
- Europe - Cluster 1 (purple) is the most common in Europe. This big cluster was never seen in Latin America. This indicates the differences of these two continents. Also cluster 4 (orange) has a strong presence and there are small exceptions like Paris
- Africa - Cluster 0 (red) that has a total of 5 members, has 3 of them in Africa
- Asia - This huge continent is by itself very different from west to east. All clusters are here with 1 and 4 being the most common
- Oceania - Although it is a small continent we can say that each city is different
Conclusion
- So now I have a better view of the clusters of the cities of the world that interest me and I know which are similar based on their venues
- I know which other cities are like my hometown and in fact I like these choices
- Finally, a company that has several stores in a city and is doing a good job, now knows which other cities are potential candidates for an expansion


Leave a Comment